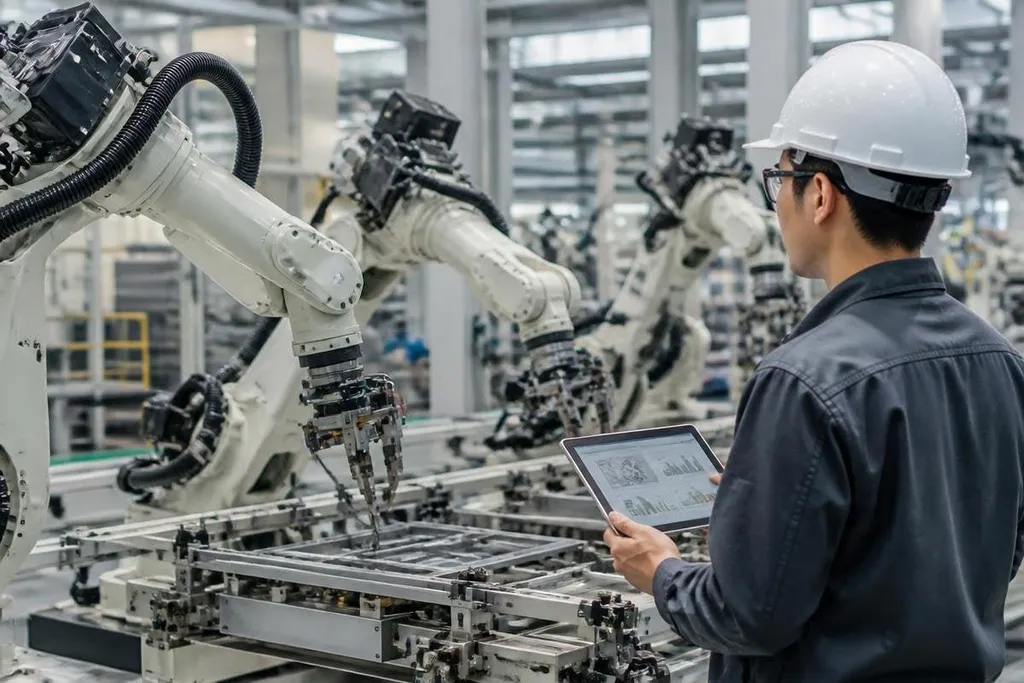
China, Japan, South Korea, Germany, and the United States belong in any serious comparison of national robotics strength. A single winner is harder to name because robot factories, research labs, warehouses, and service machines need different measures.
- Robot density shows how many industrial robots work in factories.
- Annual installations show where companies are buying machines now.
- Local companies, research groups, and public funding show whether progress can continue.
Factory robots tell only part of the story
The clearest starting point is robot density: the number of industrial robots per 10,000 manufacturing workers. This measure helps compare factory automation across countries, but it leaves out warehouse robots, surgical systems, farm machines, and research platforms.
Annual installations add a second view. A country with many new orders may be building capacity quickly, while a country with a large installed base may have automated factories over a longer period. Those are different positions, and the count should name which one it measures.
A useful report should also state the year, the type of robot, and the sector. A factory arm that loads parts cannot be compared directly with an autonomous mobile robot moving boxes or a research humanoid learning to walk.
China leads the scale question
China belongs near the top of any discussion about robotics scale because its manufacturing market is large enough to support many deployments and suppliers. That statement still needs a dated installation count before it becomes a ranking.
The useful question is not only how many robots a country buys.
Check how many are made locally, which industries use them, and whether companies can service them after installation. A high order count with weak local support would tell a different story from a smaller market with strong machine makers and integrators.
A country ranking can change when one large order skews the numbers. Use reports from Robot24 to check factory use, robot orders, new machines, and research results before you rank a national market. That keeps a big purchase from standing in for a strong robotics base.
Japan and South Korea show two different strengths
Japan is a major name in industrial robotics because its companies make factory robots, controllers, motors, and related equipment. A fair assessment should separate the strength of Japanese suppliers from the number of robots installed inside Japan.
South Korea needs the same care. Its ranking may look strong on robot density, but density reflects the shape of its manufacturing base as well as national policy. A country with many electronics or vehicle plants may record a different result from one with more food, construction, or farm work.
That distinction matters when you are choosing where to place a new automation project. You still need local integrators, spare parts, safety checks, and staff who can maintain the system. A high national score does not prove that a robot will work in your plant.
Germany and the United States measure well in different ways
Germany is an important comparison for factory automation, machine building, and industrial software. The United States brings a different mix, with strong activity in warehouse automation, artificial intelligence, logistics, and service robotics.
Those areas need separate scores.
One country can lead in factory arms and rank lower in mobile robots. Another can produce strong software and research while importing much of its hardware. Treating every machine as the same unit hides these differences.
The missing evidence in any country ranking is often the most useful part. A report should say which figures it could verify and which figures remain unavailable, rather than fill the gap with a confident label.
A practical way to compare countries
Use this checklist before accepting a claim that one country leads robotics:
- Check the year beside every number, since robot markets change quickly.
- Separate factory robots from mobile, medical, agricultural, and research machines.
- Compare installations with the active robot base, because new sales and installed stock answer different questions.
- Look for local suppliers, repair networks, system integrators, and training programs.
- Read the source method, including whether it counts imports, prototypes, pilots, or paid deployments.
I'd reject any ranking that gives one country the top place without naming its measure. The better answer is a table with several winners: one for factory density, one for manufacturing scale, one for robot suppliers, and one for research.
The next useful country comparison should publish those measures beside the year and source. Until then, “leading robotics country” is a label, not a result.